History of my Weight Loss, August 2019
What a month !! Let's get right to it.
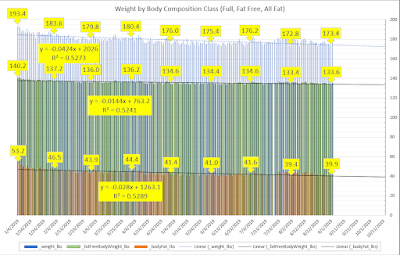 Callouts are noted at month start (ex, 173.4 on September 1). Regression lines are for ALL Data. The weight loss rate drops sharply until, say, May, when it shows a lower loss rate. I prefer using pounds weight rather than % body weight. More visibility into the process here.
In words, pounds fat lost went from a fast rate (53.2 to 41.4) to a slower rate (41.4 to 39.4), and seems to have flattened out.
Here's the monthly changes in number form (red=gain, black=loss). I lose about 2 units fat to one unit lean. Haven't been able to impact that ratio yet.
 It's much easier to read these, than the charts. The monthly numbers don't have the daily wiggles.
What made August a remarkable month? July. We spent a week on The Cape, and I ate and drank everything in sight. I had a freaking GREAT time, and I'd do it all again. Check this graph ...
 Pretty much under the regression trend line, until July. Picnic time, party time, protein on carb buns washed down with beer time, a week on The Cape time. My body responded by saving excess energy (body fat increase) and losing skeletal muscle (next chart).
Did I ever mention that my metabolism is f'd up?
Of all the things I want in my future, loss of skeletal muscle is NOT on the list. Here's the definition.
 The Elderly tend to lose muscle as they age. No bueno. So, I'm sitting here, late July, getting older, losing muscle mass, and not losing much body fat. What to do?
Eat more protein. See this for more detail. In essence, consume more grams of protein than grams of carbs and fats combined. This is referred to as the P:E (Protein : Energy) ratio. Protein is a structural component, where carbs and fat are energy components. The more muscle structure you grow, and the less energy you take in, makes it easier to use your own body fat for fuel.
For a hundred thousand reasons, this is not as easy as it sounds.
 The data is noisy, and the relationships between things are not instant or even daily. So, moving averages are a good way to dampen the noise. My goal is to have a P:E intake greater than 1, and hopefully, much greater.
How to do that? Lean meat, a lot of water, minimize fatty and carby foods. But, he said, what about whiskey?
I've not seen any food tracking stuff that properly accounts for alcohol (7 kCal per gram, about 90 kCal per ounce). So, I built a "recipe" for spirits in myFitnessPal that counts whiskey as fat. That helps the accounting stay a bit more rational.
That's nice, but what to do? Me, I've experience with THC, and am willing to substitute THC for whiskey. WAY fewer calories, slightly different buzz. But there's a supply chain issue. Pot shops are legal in MA, but not in NY. Cape Cod, by coincidence, is in MA. So, after that week, P:E increases, and weight declines. But, now I need to drive to MA for re-supply ...
My Wife asked me if that's working for me. I think "yes" ...
 The spiky columns are my internal daily measure of my current HbA1c. If you're interested in how I get those numbers, just ask. It's straightforward, but to complicated for this post.
The big spikes to the right are "Cape Cod et al". The tall red line is when my Cape Cod supply ran out ...
So, now what? Effort to get the P:E numbers I want. As much exercise, mostly cardio, as I can arrange. Plan the next trip to MA.
Any questions, just ask in the comments, or anywhere, for that matter.
Be well.

In words, pounds fat lost went from a fast rate (53.2 to 41.4) to a slower rate (41.4 to 39.4), and seems to have flattened out.
Here's the monthly changes in number form (red=gain, black=loss). I lose about 2 units fat to one unit lean. Haven't been able to impact that ratio yet.
 It's much easier to read these, than the charts. The monthly numbers don't have the daily wiggles.
What made August a remarkable month? July. We spent a week on The Cape, and I ate and drank everything in sight. I had a freaking GREAT time, and I'd do it all again. Check this graph ...

Did I ever mention that my metabolism is f'd up?
Of all the things I want in my future, loss of skeletal muscle is NOT on the list. Here's the definition.

Eat more protein. See this for more detail. In essence, consume more grams of protein than grams of carbs and fats combined. This is referred to as the P:E (Protein : Energy) ratio. Protein is a structural component, where carbs and fat are energy components. The more muscle structure you grow, and the less energy you take in, makes it easier to use your own body fat for fuel.
For a hundred thousand reasons, this is not as easy as it sounds.

How to do that? Lean meat, a lot of water, minimize fatty and carby foods. But, he said, what about whiskey?
I've not seen any food tracking stuff that properly accounts for alcohol (7 kCal per gram, about 90 kCal per ounce). So, I built a "recipe" for spirits in myFitnessPal that counts whiskey as fat. That helps the accounting stay a bit more rational.
That's nice, but what to do? Me, I've experience with THC, and am willing to substitute THC for whiskey. WAY fewer calories, slightly different buzz. But there's a supply chain issue. Pot shops are legal in MA, but not in NY. Cape Cod, by coincidence, is in MA. So, after that week, P:E increases, and weight declines. But, now I need to drive to MA for re-supply ...
My Wife asked me if that's working for me. I think "yes" ...

The big spikes to the right are "Cape Cod et al". The tall red line is when my Cape Cod supply ran out ...
So, now what? Effort to get the P:E numbers I want. As much exercise, mostly cardio, as I can arrange. Plan the next trip to MA.
Any questions, just ask in the comments, or anywhere, for that matter.
Be well.


Comments