Day 180, Confessions of a WannaBe Former T2D
Today, February 11, 2019, is the 180th day of BG data collection, during this phase of my journey to become a former T2D. I'm impressed that I've hung in this for so long, and grateful for all your support.
Progress:
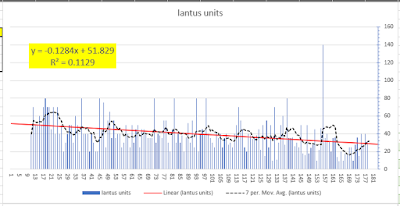
What was an Lantus 80 units per day habit, is now in the mid 30's.
What was an HbA1C measure of 7.3 now is (estimated to be) 6.8.
What was a 196 pound male in mid-November 2018 is now 182.8 pounds.
What was a body fat % of 27.5% on January 4, 2019, is today 25.1%.
Of the January 4, 2019 to February 11, 2019 range of weight loss (Max to Min), 13.8 pounds of me went somewhere. 9.4 pounds of fat, 4.2 pounds of muscle mass.
I still exercise 2-3 times per week, every week, and while progress is small, it's progress.
I expect to drop Metformin in a few weeks, after I get back my (expected great) lab work.
I am a LOT better at using Excel.
There's more, but let's look at the numbers. Charts of interest ...
I'm certainly not done, or perfect, but I'm a heck of a lot better than I was. Progress.
Progress:
What was an Lantus 80 units per day habit, is now in the mid 30's.
What was an HbA1C measure of 7.3 now is (estimated to be) 6.8.
What was a 196 pound male in mid-November 2018 is now 182.8 pounds.
What was a body fat % of 27.5% on January 4, 2019, is today 25.1%.
Of the January 4, 2019 to February 11, 2019 range of weight loss (Max to Min), 13.8 pounds of me went somewhere. 9.4 pounds of fat, 4.2 pounds of muscle mass.
I still exercise 2-3 times per week, every week, and while progress is small, it's progress.
I expect to drop Metformin in a few weeks, after I get back my (expected great) lab work.
I am a LOT better at using Excel.
There's more, but let's look at the numbers. Charts of interest ...
 |
| Lantus Use, Daily. Occasional Big Use, but good downtrend |
 |
| Days Back BG averages, auto updated, and time weighted, to estimate HbA1C |
 |
| % of Me, Fat Free Mass, and Body Fat, trending well. |
Comments
You might find this amusing...https://xkcd.com/2110/
I use the regressions to 1) draw the line on the chart, and 2) look for 'going up' or 'going down'.
Many of the R-squared values aren't terribly meaningful. The data sets for BG stuff, for example, is simply a day by day record. There's no process that corresponds to the index. Whereas, something like my Targeting Shot Size chart, has an R-squared value of .82, in part because there's something quite real going on.
I find Box and Whisker charts fascinating ...
Thanks